How Plant Disease Identifiers Work: A Technical Perspective
Accurate and timely diagnosis of plant diseases is central to plant pathology, crop protection, and sustainable agriculture. For centuries, identification depended on macroscopic symptom assessment, microscopic analysis of spores and hyphae, and pathogenicity tests.
These remain gold standards in professional laboratories; recent advances in computer vision and plant informatics have enabled portable diagnostic systems—commonly known as plant disease identifier tools—that function through smartphone applications and digital platforms.
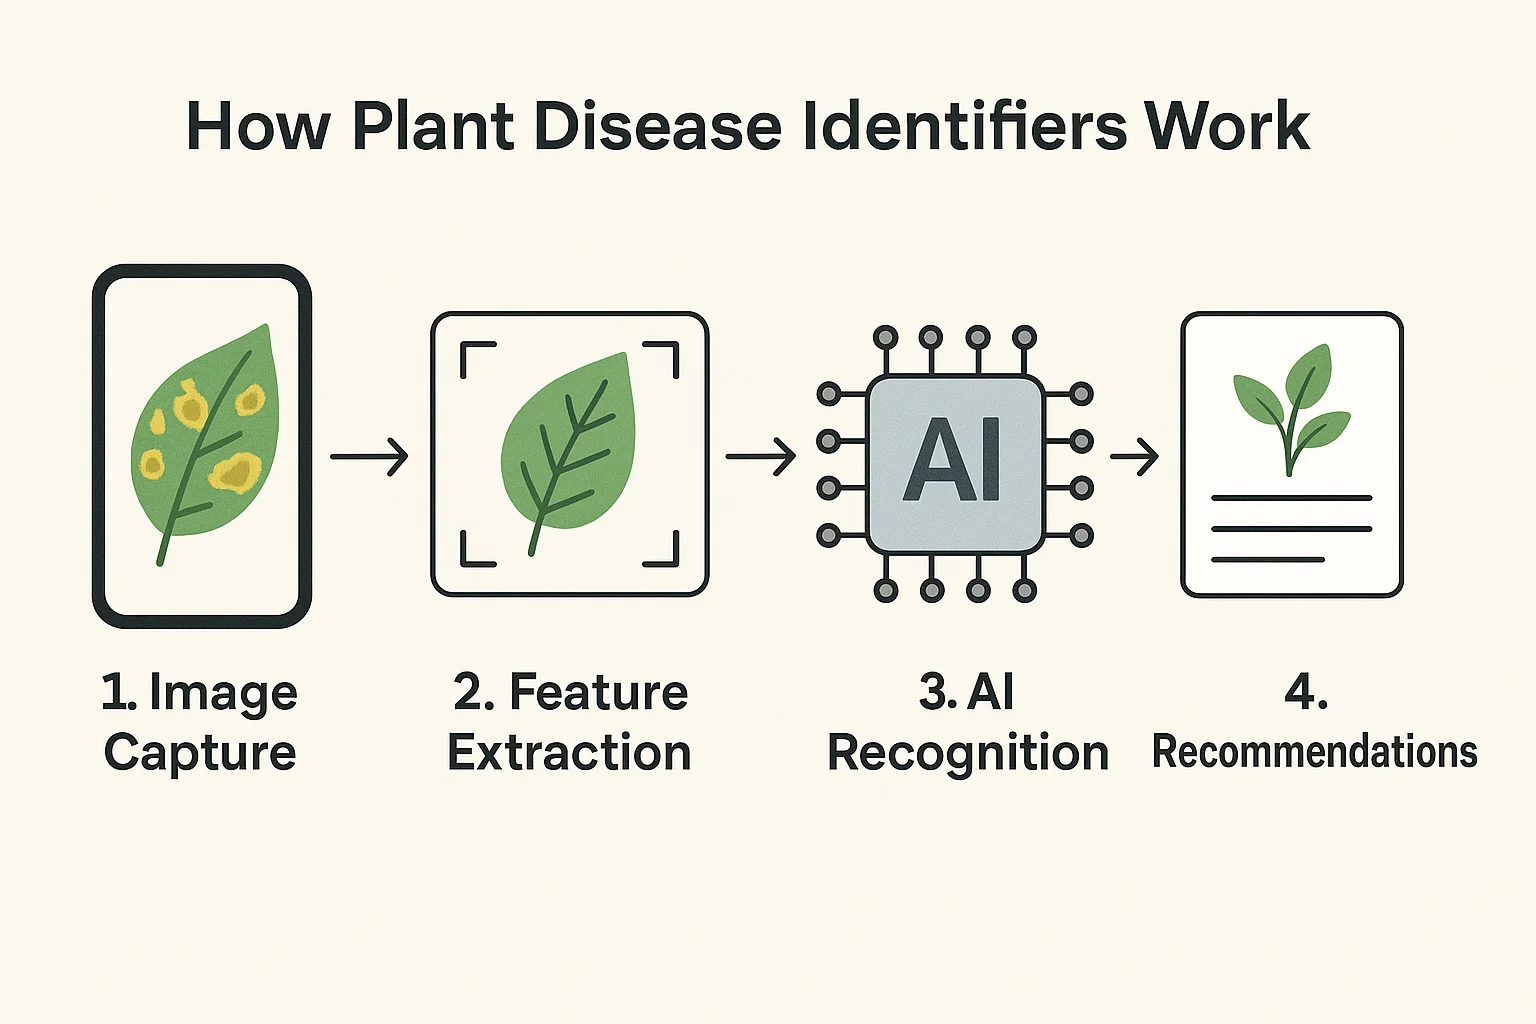
Image Acquisition and Preprocessing
The diagnostic process begins when a user captures an image of symptomatic tissue, typically leaves, fruits, or stems. Accurate capture is critical, since poor resolution or improper lighting may obscure diagnostic features. Once uploaded, the system applies preprocessing algorithms designed to reduce interference and highlight pathological traits.
Typical preprocessing steps include:
Segmentation: isolating plant tissue from the background to remove irrelevant features such as soil, sky, or human hands.
Normalization: adjusting color balance and contrast to ensure lesions or discolorations are accurately represented.
Noise reduction: eliminating visual artifacts that could mimic symptoms, such as water droplets or shadows.
This stage ensures that subsequent analysis focuses solely on the morphological and chromatic cues relevant to disease identification.
Feature Extraction
Following preprocessing, the system identifies measurable attributes of the symptomatic tissue. These attributes correspond closely to diagnostic criteria used in classical plant pathology.
Key extracted features include:
Chromatic indices: quantification of yellowing (chlorosis), browning (necrosis), or purpling associated with vascular disorders or fungal toxins.
Texture metrics: recognition of powdery, velvety, or concentric ring-like patterns that indicate pathogens such as Erysiphales (powdery mildew) or Alternaria.
Morphological patterns: identification of lesion shape (angular, circular, irregular), size distribution, and boundary definition.
Spatial distribution: assessment of whether symptoms are uniform across the lamina, restricted to veins, or localized to margins, which helps distinguish between bacterial, viral, and fungal etiologies.
This step replicates the visual and tactile examination traditionally performed by plant diagnosticians but converts it into quantitative data.
Pattern Recognition and Classification
Once features are extracted, they are compared against reference datasets built from extensive libraries of confirmed plant disease images and symptom profiles. Advanced systems apply computational models that are trained to recognize patterns indicative of specific pathogens.
For instance:
Angular, water-soaked lesions with chlorotic halos may indicate bacterial leaf spots (Xanthomonas spp., Pseudomonas spp.).
Concentric necrotic rings suggest early blight (Alternaria solani).
White superficial mycelium on the adaxial surface of leaves is diagnostic for powdery mildew.
By evaluating probability scores across multiple potential diagnoses, the system narrows the field to the most likely causal agents. Unlike human diagnosis, which depends heavily on expertise, these tools utilize extensive datasets to provide consistent recognition across diverse environments.
Integration with Plant Pathology Databases
Diagnosis is refined through cross-referencing with curated databases of plant diseases, pathogens, and host-pathogen interactions. These repositories contain information not only on visual symptoms but also on host specificity, epidemiology, and geographic occurrence.
For example:
If lesions resemble rice blast but the user is located outside rice-growing zones, the system may reduce its confidence in that diagnosis.
If a fungal symptom is observed on citrus, the database cross-checks whether known citrus pathogens in the region include Phyllosticta citricarpa (citrus black spot).
This contextual integration reduces false positives and aligns diagnoses with real-world plant-pathogen distributions.
Diagnostic Output and Recommendations
The final stage is the presentation of a diagnosis in a form accessible to the end user. Typically, the output includes:
Name of the suspected disease (common and scientific).
Pathogen identity (fungus, bacterium, virus, or oomycete).
Symptom description for manual confirmation.
Photographic references for comparison.
Recommended management practices, which may cover cultural controls (crop rotation, sanitation, irrigation practices), biological agents (antagonistic fungi such as Trichoderma), and chemical protectants or curatives where appropriate.
Advanced platforms extend this further, incorporating plant care tools such as irrigation calculators, fertilization reminders, or environmental sensors, creating integrated plant health management systems.

Pros and Cons
Strengths of Plant Disease Identifiers
These systems bring several advantages over conventional diagnostic methods:
Speed: A preliminary diagnosis can be achieved in seconds, compared to days or weeks for laboratory culturing or molecular assays.
Accessibility: Non-specialists, including smallholder farmers and hobbyists, can access diagnostic insights without advanced training.
Scalability: Thousands of users can simultaneously submit queries, creating real-time disease surveillance networks.
Educational value: Users learn to associate visual symptoms with specific diseases, gradually improving observational skills.
Limitations and Challenges
Despite their utility, plant disease identifiers cannot fully replace expert pathologists. Limitations include:
Ambiguous symptoms: Nutrient deficiencies often mimic viral infections, leading to misclassification.
Rare pathogens: Databases may lack sufficient image coverage for uncommon or region-specific diseases.
Image quality dependence: Poor lighting, low resolution, or partial lesions reduce accuracy.
Dynamic pathogen evolution: Emerging races of fungi or new viral strains may not be represented in the database.
Thus, while effective for early detection and general guidance, these tools should be complemented with laboratory diagnostics for high-stakes agricultural decisions.
Conclusion
Plant disease identifiers transform photographic evidence of plant symptoms into quantifiable data, analyze this data against curated pathology databases, and deliver a probable diagnosis with management recommendations.
While limitations remain, their integration into broader crop management systems offers enormous potential for improving plant health monitoring and ensuring agricultural resilience in the face of global disease pressures.